Tutorial — Configure & Run Live Analysis
This tutorial walks the full GEECS-Plugins analysis loop end to end, using only the GUIs. By the end you'll have:
- Built a per-camera analyzer config in ConfigFileGUI
- Added it to a group config that LiveWatch can dispatch
- Run that group against a real scan with LiveWatch
It's the canonical workflow most users adopt for live shift analysis. No Python required.
Before you start
You should already have:
-
~/.config/geecs_python_api/config.iniset up. The Scanner GUI's first-launch wizard creates it; copy from a working teammate if needed. Minimal contents look like:[Paths] geecs_data = Z:\path\to\experiment\user data scan_analysis_configs_path = Z:\path\to\GEECS-Plugins-Configs\scan_analysis_configs image_analysis_configs_path = Z:\path\to\GEECS-Plugins-Configs\image_analysis_configs [Experiment] expt = Undulator rep_rate_hz = 1LiveWatch resolves data paths from this file:
geecs_datais the experiment data root it walks looking for new scan folders, andscan_analysis_configs_pathis what its Analyzer Group dropdown discovers groups from. -
A scan_analysis_configs/ directory checked out and writable. This usually lives in the sister
GEECS-Plugins-Configsrepo alongside this one. - At least one completed scan folder under the data root for whatever date you want LiveWatch to process. If you don't have one handy, use a previous day's folder — LiveWatch can back-date freely.
If those three are in place, you're ready.
1. Author the analyzer config
Launch ConfigFileGUI:
poetry run python ScanAnalysis/ConfigFileGUI/main.py
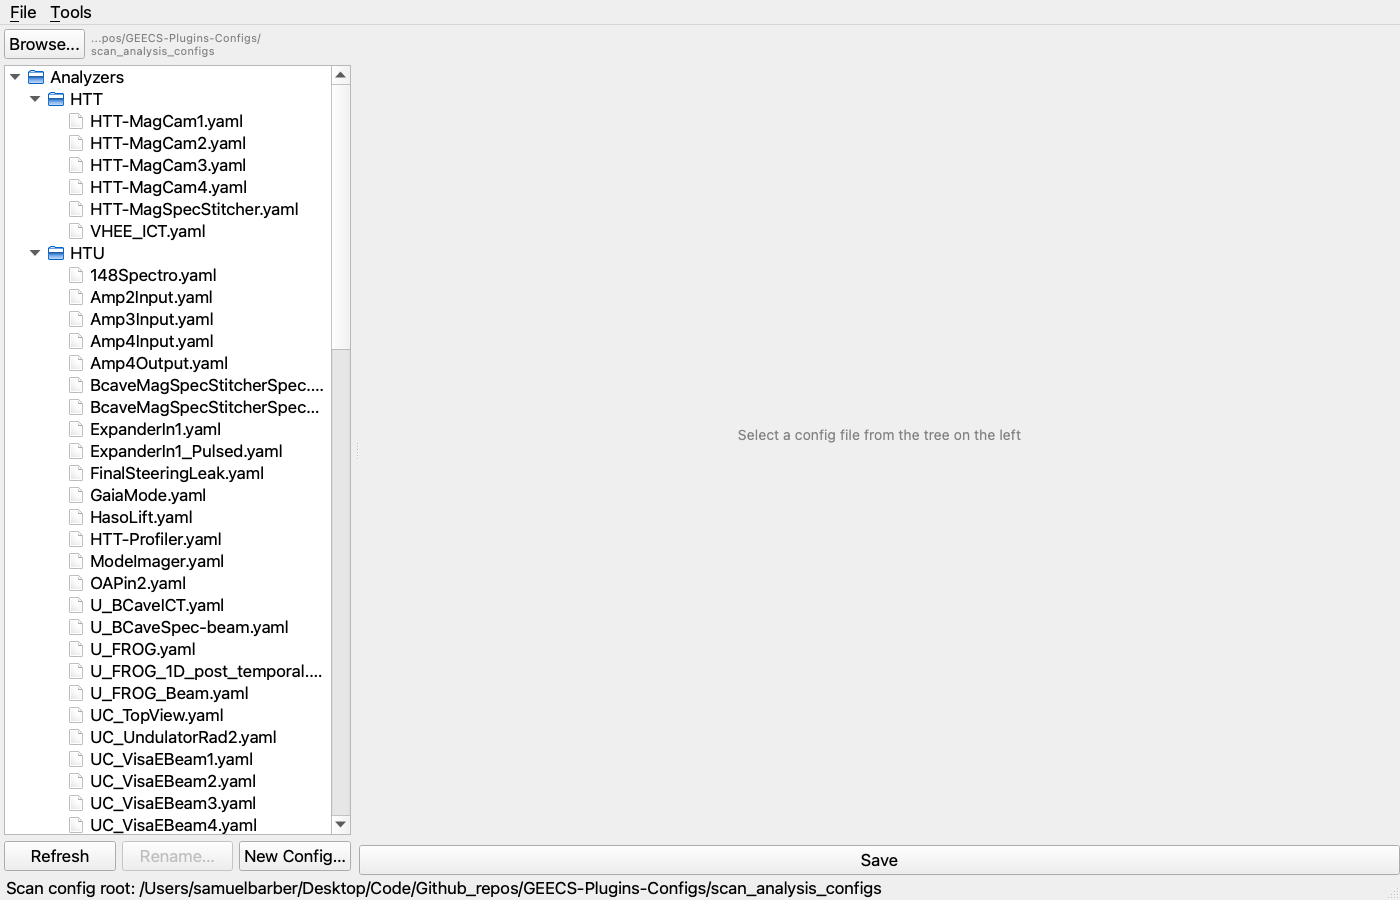
Click File → Open Directory… and pick your scan_analysis_configs/
root. The left panel populates with the analyzer and group trees:
For this tutorial, we'll edit an existing camera analyzer rather than
build one from scratch — the field-by-field experience is identical, and
starting from a working file is the friendlier introduction. Click any
camera analyzer in the tree (e.g. HTU/UC_TopView.yaml):
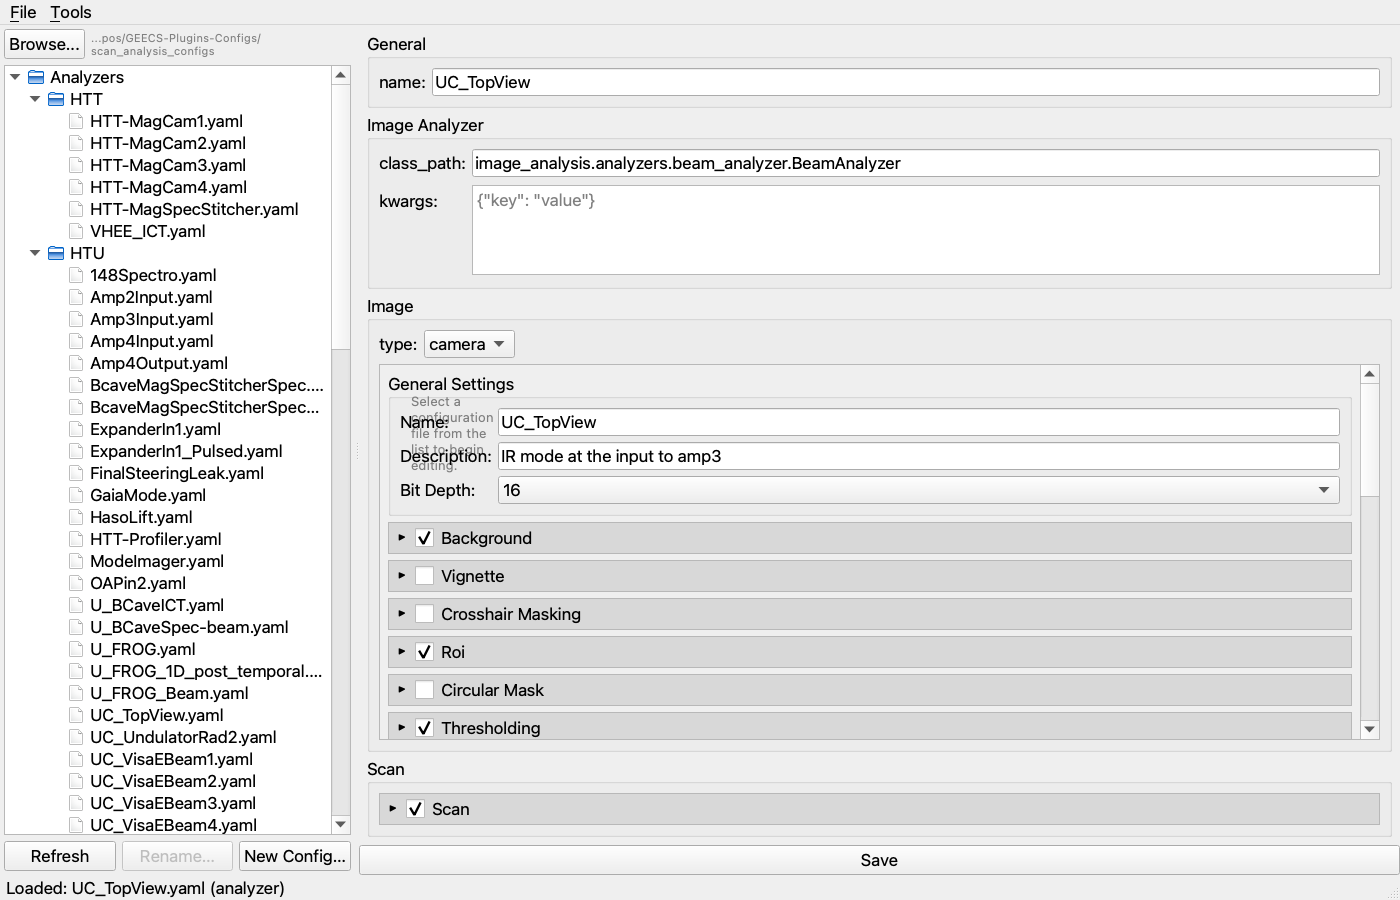
The editor renders the typed form. The key sections:
- Top fields (
name,image_analyzer,kwargs). Theimage_analyzeris the dotted path of the Python class that runs against each shot — swap it to use a different analyzer family (e.g.image_analysis.analyzers.standard_analyzer.StandardAnalyzerinstead ofBeamAnalyzer).kwargsare constructor arguments handed to that class. - Image section — the per-shot processing pipeline.
type: camerapicks theCameraConfigschema; switching tolinere-renders for a 1D signal. ROI, Background, Thresholding, etc. are individual processing steps; tick the header checkbox to include a step in the active pipeline, leave it unchecked to omit. - Scan section — controls how this analyzer is invoked at the scan
orchestration level: priority, mode (
per_shotvs aggregated), GDoc upload slot.
Edit any field you like. The validator runs as you type — invalid values show in the status bar.
Verifying the YAML
If you want to see exactly what gets written when you save, toggle Tools → Toggle YAML Preview:
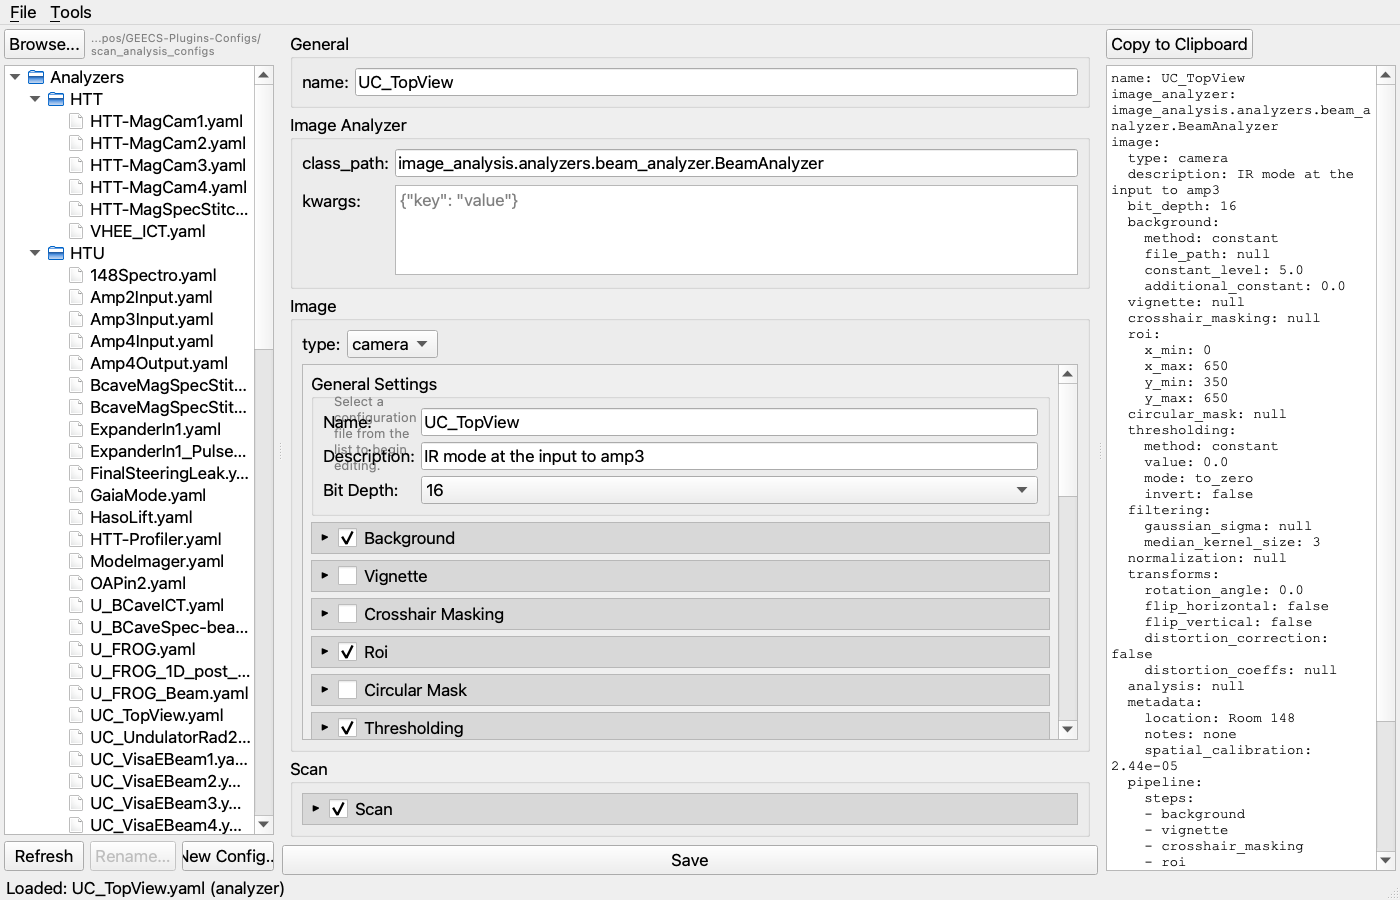
The preview updates live. A representative camera-analyzer YAML looks like:
name: UC_TopView
image_analyzer: image_analysis.analyzers.beam_analyzer.BeamAnalyzer
image:
  type: camera
  bit_depth: 16
  roi: {x_min: 0, x_max: 650, y_min: 350, y_max: 650}
  background: {method: constant, constant_level: 5.0}
  thresholding: {method: constant, value: 0.0, mode: to_zero}
  pipeline:
    steps: [background, roi, thresholding]
scan:
  priority: 50
  mode: per_shot
Save when you're satisfied (Ctrl+S or the button below the editor).
The file is written, the canonical formatting is preserved, and the next
analyzer in the tree is one click away.
2. Add the analyzer to a group
Groups are the unit LiveWatch dispatches. A group is a named list of analyzer refs, each optionally overridden per-group.
In the left tree, scroll down to groups/ and click an existing group
(e.g. HTU/baseline.yaml):
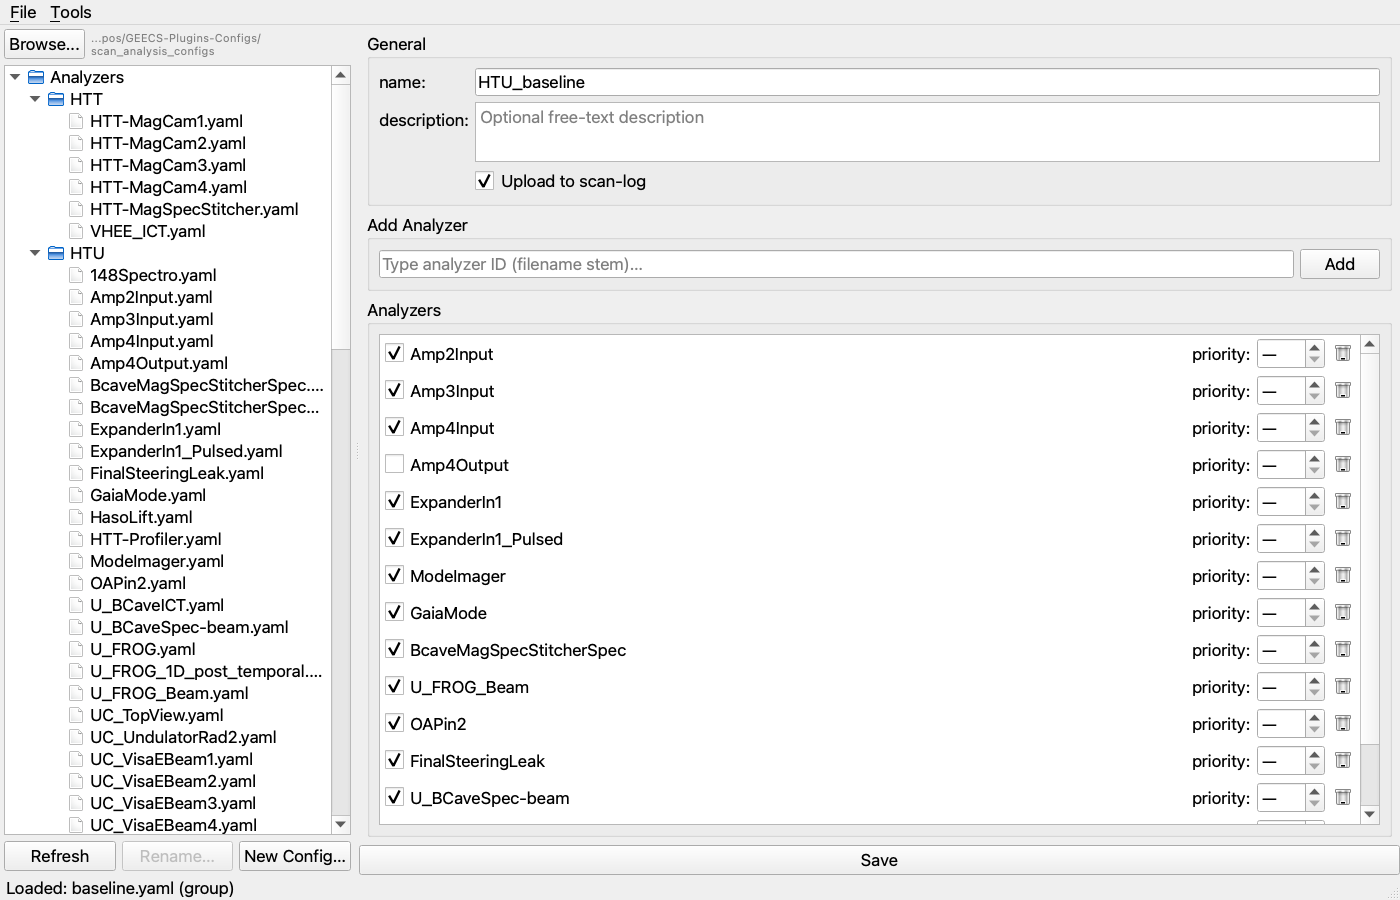
The group editor shows:
nameanddescription— the group's human-readable identity.upload_to_scan-log— when ticked, each member's display files go to the Google Doc e-log on completion.- Add analyzer picker — type-ahead over every analyzer YAML in the tree. Start typing the name of the analyzer you just edited; pick it from the dropdown; click Add.
- Per-entry rows — each analyzer ref has a checkbox (include this
run), a priority dropdown (override the analyzer's own
scan.priorityper-group, or leave unset to inherit), and a remove button.
Save the group when you're done.
A representative group YAML reads:
name: HTU_baseline
description: standard HTU shift analysis
upload_to_scan-log: true
analyzers:
  - Amp4Input
  - Amp4Output
  - UC_TopView
  - {ref: GaiaMode, priority: 5}     # explicitly bumped vs the bare entry below
The bare-string form UC_TopView and the dict form {ref: Foo, priority: N}
both work; the editor preserves whichever you used.
3. Run the group with LiveWatch
Launch LiveWatch:
poetry run python ScanAnalysis/LiveWatchGUI/main.py
The main window fills in defaults from your config.ini:
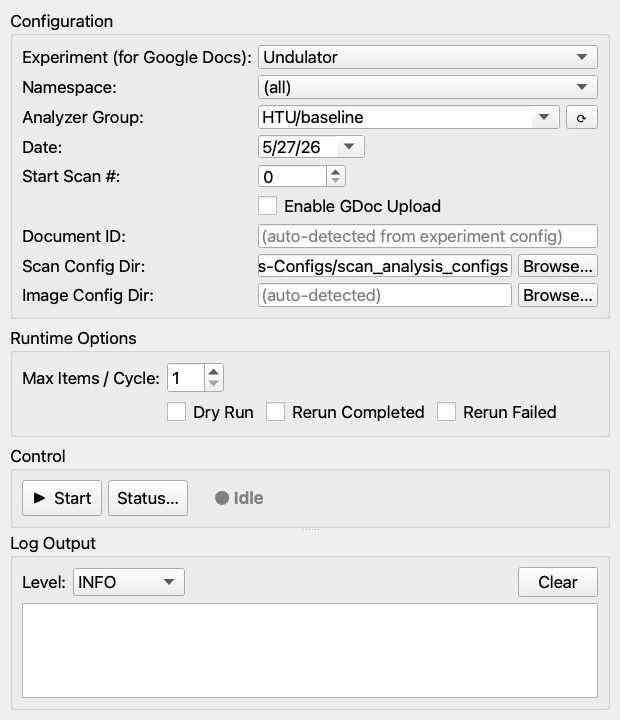
Field-by-field for our purpose:
- Experiment (for Google Docs) — leave at
Undulator(or whichever experiment matches the group you're about to run;(none)to disable e-log upload entirely). - Namespace —
(all)shows every group; pick a namespace to filter. - Analyzer Group — pick the group you just edited (e.g.
HTU/baseline). The dropdown auto-populates fromscan_analysis_configs/groups/. - Date — defaults to today. Back-date if you want to reprocess a previous day.
- Start Scan # —
0for "every scan from the start of the day," otherwise the first scan number to consider. - Enable GDoc Upload — only when you actually want results in the e-log.
Sanity-check with a dry run
Before letting it loose on real data, tick Dry Run in the Runtime Options box and click ▶ Start. The runner walks the day's scans and reports what it would dispatch for each, without running anything. The log panel shows you exactly which analyzers got matched to which scans.
Look at the output. If a scan that should be processed is being skipped, the log tells you why (already completed, marked failed, no matching device, etc.). When the dry run is clean, untick Dry Run and Start again — this time for real.
Watching it work
While the runner is alive, the status pip flips to Running (green) and
the log panel streams the runner's logs:
- Discovery: which scans match the date / start-number filter.
- Dispatch: which analyzers from the group are being kicked off for each scan.
- Completion: each analyzer's exit state and the display files it produced.
For per-task detail, click Status… to open the per-scan, per-analyzer grid. Failures show their traceback inline.
When everything's been processed, the runner idles, watching for new scans. Stop it with ⏹ Stop (replaces Start while running).
4. Where the output lives
LiveWatch writes results into a sibling analysis/ tree next to
scans/:
{geecs_data}/{experiment}/Y{YYYY}/{MM-Month}/{YY_MMDD}/
├── scans/
│   ├── Scan001/
│   ├── Scan002/
│   └── …
└── analysis/
    ├── Scan001/
    │   ├── UC_TopView/
    │   │   ├── summary_figure.png
    │   │   └── …
    │   └── …
    └── …
Inside each analysis/ScanNNN/<analyzer>/ you'll find the analyzer's
display files (typically PNGs), any derived scalars, and a status YAML the
task queue uses to track completion. If GDoc upload was enabled, the same
display files will appear in the experiment's Google Doc.
What to do next
You now have the full loop. The places to go from here:
- Author a new analyzer from scratch. Same flow as Step 1, but click New Config… below the tree. ConfigFileGUI seeds defaults you can tweak.
- Build a custom group. Same flow as Step 2, but start from New Config… to pick a group YAML location.
- Inspect the underlying API. Everything ConfigFileGUI and LiveWatch
do is also available headlessly via Python — see
Image Analysis overview for the
per-image API and
Scan Analysis overview for the
LiveTaskRunnerthat LiveWatch wraps. - Diagnose a recurring failure. The
/triageskill parses scan logs into a markdown summary that classifies errors by source — see Skills.